Capacity
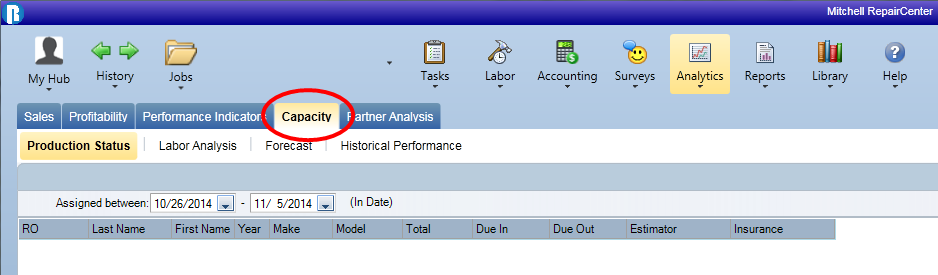
Use the Capacity tab on the Analytics menu to review your shop's product and labor capacity, as well as historical performance and forecasting.
The Capacity tab includes the following sub-tabs:
- Production Status: View the Status of Repair Orders in production.
- Labor Analysis: View a details of all labor for each Repair Order.
- Forecast: View potential production dollars and hours for each department, as well as for the shop as a whole.
- Historical Performance: View production information for repair orders that have been completed.
You can filter you view of data on any of these tabs for a more granular analysis. You can also export the data to a CSV or HTML file.
How to
- Do one of the following:
- Click
 , and then click the Capacity tab.
 - Click
 . The Analytics list displays.
- Click one of the following tabs or options in the Analytics list:
- Production Status
- Labor Analysis
- Forecast
- Historical Performance
This tab shows the status of Repair Orders in production. You can filter the information using the steps below:
- Select the date range in the between and (In Date) lists.
- Select one of the following in the Select list:
- Make
- Estimator
- Insurance Company
- All
- Select one of the following in the Jobs have been box:
- Assigned
- Flagged
- Completed
- Delivered
- Closed
- Click Apply Filter.
Labor Analysis tab provides you with a breakdown of all labor for each RO. You can filter your view using the steps below:
- Do one of the following:
- Click Include On Hold to include all Repair Orders on hold.
- Clear the Include On Hold check box to exclude orders on hold.
- Click
 to open the calender and select the Sold between date range.
 - Select one on the following in the Filter by list:
- All
- Un-assigned
- Over-assigned
- Un-flagged
- Over-flagged
- Over-actuals
- Click Apply Filter.
The Forecast tab allows you to see potential production dollars and hours for each department, as well as for the shop as a whole. Apply filters to get a more granular view of your shop's future production capabilities:
- Click any of the following check boxes as needed:
- Show Started Jobs Only: Show only those jobs that have been started within the date range you specify.
- Exclude On Hold Jobs Hide any jobs that have been put on hold.
- Include Multi-Shops Show data from shops in your network.
- Select one of the following in the Date list:
- Sold
- Due In
- Due Out
- Started
- Click to open the calender and select the Sold between date range.
- At the bottom of the page, click any of the following check boxes to see totals for different departments:
- Body
- Paint
- Mech
- Fame
- Other
- Click Apply Filter.
Tip: Click Reset to return filters to default settings.
The Historical Performance tab shows production information for repair orders that have been completed. Apply filters for a more granular view of the data:
- In the Date list, select one of the following:
- Completed
- Delivered
- Closed
- Click to open the calender and select the Sold between date range.
- At the bottom of the page, click any of the following check boxes to see totals for different departments:
- Body
- Pain
- Mech
- Fame
- Other
- Click Apply Filter.
Tip: Click Reset to return to all default filtering options (Date = Completed; Date range = current date to 90 days from current date).
You can print your data found on the Labor Analysis, Forecast, and Historical Performance tabs.
- Access the desired tab and apply filters as needed.
- Click Print. The Print Preview window appears.
- Click
 . The Print dialog box appears.
 - Select the desired printer and click Print.
- Access the Capacity tab.
- Right-click on any line of data, and then click Save All Lines to CSV File.
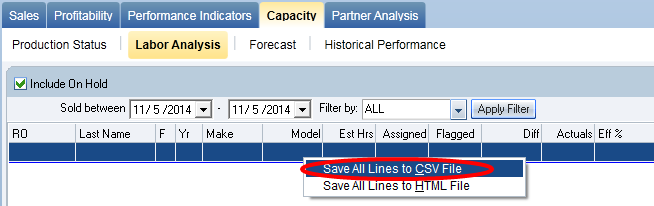
- In the Save As Dialog box, browse to the location you want to save your file, and then click Save.
- Access the Capacity tab.
- Right-click on any line of data, and then click Save All Lines to HTML File.
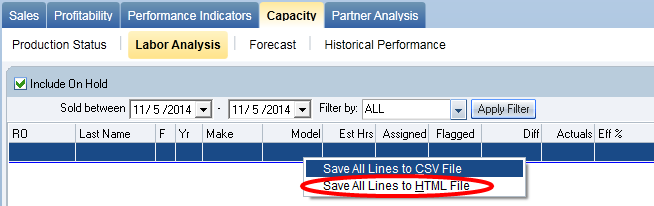
- In the Save As Dialog box, browse to the location you want to save your file, and then click Save.
Reference
| Field | Description |
| RO |
The number of the selected Repair Order. |
| Last Name, First Name |
The customer's first and last names. |
|
Year, Make, Model |
Vehicle information. |
|
Total |
Total amount of the Repair Order. |
|
Due In, Due Out |
Dates the vehicle is scheduled in and out. |
|
Estimator |
The person who wrote the original estimate. |
|
Insurance |
The insurance company for the repair order. |
| Total Jobs |
The total number of jobs in the list. |
| Total Hours |
The total number of labor hours. |
| Field | Description |
|
Shop |
The Shop name. |
|
RO |
The number of the selected Repair Order. |
|
Last Name, First Name |
The customer's first and last names. |
|
Yr, Make, Model |
Vehicle information. |
|
Est Hrs |
Total hours estimated for the RO. |
|
Assigned |
Labor Hours currently assigned to the RO. |
|
Flagged |
Labor Hours currently flagged for the RO. |
|
Diff |
The difference between flagged and assigned labor hours. |
|
Actuals |
Actual hours for the RO. |
|
Eff % |
The efficiency percentage of the labor for the RO. |
|
Total Estimated Hours |
Total hours estimated for all Repair Orders in your filtered list. |
|
Total Assigned Hours |
Total labor hours currently assigned to all Repair Orders in your filtered list. |
|
Total Flagged Hours |
Total labor hours currently flagged for all Repair Orders in your filtered list. |
|
Total Jobs listed |
Total number of Repair Orders in your filtered list. |
|
Overall Efficiency of all listed jobs |
The average efficiency percentage of labor for all Repair Orders in your list. |
| Field | Description |
|
Shop |
If Include Multi-Shops is selected, the first column shows the shop name. |
|
Sold |
The date the customer signed off on the estimate. |
|
RO |
The number of the selected Repair Order. |
|
Last Name, First Name |
The customer's first and last names. |
|
Yr, Make, Model |
Vehicle information. |
|
Due In, Due Out |
Dates the vehicle is scheduled in and out. |
|
Total $ |
Total dollar amount for the repair order. |
|
Total Hrs |
Total number of estimated labor hours for the repair order. |
|
Body |
Total number of body hours for the repair order. |
|
Paint |
Total number of paint hours for the repair order. |
|
Frame |
Total number of frame hours for the repair order. |
|
Mech |
Total number of mechanical hours for the repair order. |
|
Other |
Total number of other labor hours scheduled for the repair order. |
|
Days |
The total days included in the criteria you have set. |
|
Jobs |
The total number of jobs included in the set criteria. |
|
Total$ |
The total dollar amount for the ROs in the list. |
|
Avgs |
The total dollar amount divided by the total days. |
|
Avg |
The total dollar amount divided by the total jobs. |
|
Avg Jobs/Day |
The average number of jobs scheduled to be done per day. |
|
Total Avg Hrs/day |
Total average hours per day. |
|
Avg Hrs/Day per Tech |
Average hours per day per technician. |
|
Num Techs |
Number of technicians in the field. Adjust this number to change the Avg Hrs/Day per Tech |
Tip: Click Refresh to see adjusted potential production capabilities.
|
Shop |
If Include Multi-Shops is selected, the first column shows the shop name. |
|
Closed |
The date the repair order was closed. |
|
RO |
The number of the selected Repair Order. |
|
Last Name, First Name |
The customer's first and last names. |
|
Yr, Make, Model |
Vehicle information. |
|
Estimator |
The person who wrote the original estimate for the job. |
|
Insurance |
The insurance company associated with the repair order. |
|
Total $ |
Total dollar amount for the repair order. |
|
Total Hrs |
Total number of hours needed to completed the repair order. |
|
Body |
Total number of body hours for the repair order. |
|
Paint |
Total number of paint hours for the repair order. |
|
Frame |
Total number of frame hours for the repair order. |
|
Mech |
Total number of mechanical hours for the repair order. |
|
Other |
Total number of other labor hours that were needed to complete the repair order. |
|
Days |
The total days included in the criteria you have set. |
|
Jobs |
The total number of jobs included in the set criteria. |
|
Sales |
The total sales that resulted from the repair orders that fit the criteria. |
|
Avg $ |
The total dollar amount divided by the total days. |
|
Avg |
The total dollar amount divided by the total jobs. |
|
Avg Jobs/Day |
The average number of jobs done per day. |
|
Total Est Hrs |
The total hours originally estimated. |
|
Total Flg Hrs |
The total hours flagged. |
|
Avg Hrs/Job |
Average hours spent on Repair Orders. |
|
Avg Hrs/Day |
Average hours per day spent on Repair Orders. |
|
Avg Hrs/Day per Tech |
Average hours per day per technician. |
|
Num Tech |
Number of technicians in the field. Adjust this number to change the Avg Hrs/Day per Tech |